Thesis
Twenty million: the North American regions the size of the Bajío-Occidente
The Bajío-Occidente is home to 22.1 million people. North America has only a handful of regions that size: greater Mexico City, the Texas Triangle, Southern California, New York, Florida and the Québec City–Windsor Corridor, plus Guatemala and Hispaniola. With the same number of people, the Texas Triangle produces six times more per person.
Origination and structuring of USD 5–50M infrastructure projects across the Bajío.
Let's discuss your projectBajío Ventures · October 2026
The five states of the Centro-Bajío-Occidente Alliance — Aguascalientes, Guanajuato, Jalisco, Querétaro and San Luis Potosí — are home to 22.1 million people, according to INEGI’s 2025 Intercensal Survey. That is 17% of Mexico’s population on 10% of its land.
Twenty million is an uncommon scale. Across North America, from Canada to the Caribbean, we found only seven urban regions and two countries of that size. This map shows where they are.
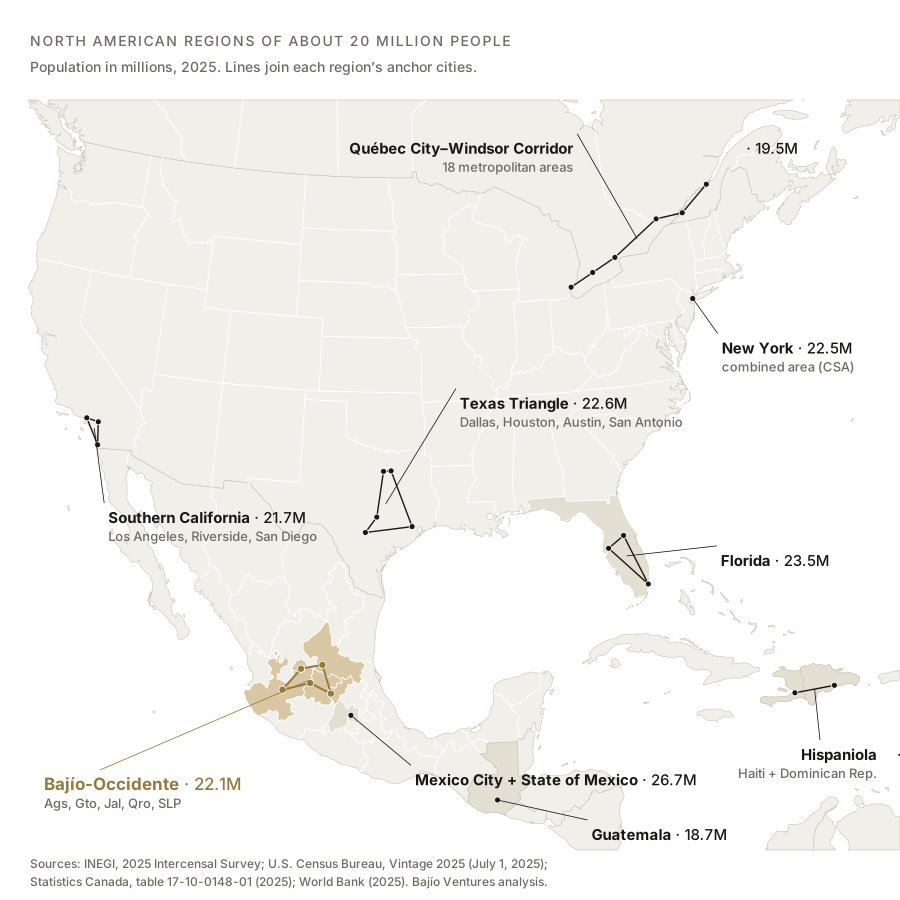
Nine places with the same mass of people
| Region | What it includes | Population 2025 (millions) | GDP per person (USD thousands) |
|---|---|---|---|
| Mexico City + State of Mexico | Both entities in full | 26.7 | 16 |
| Florida | The whole state | 23.5 | 73 |
| Hispaniola | Haiti and the Dominican Republic | 23.4 | — |
| Texas Triangle | Dallas–Fort Worth, Houston, Austin and San Antonio | 22.6 | 93 |
| New York | Combined statistical area (CSA) | 22.5 | 121 |
| Bajío-Occidente | Ags, Gto, Jal, Qro and SLP in full | 22.1 | 15 |
| Southern California | Los Angeles (CSA) and San Diego | 21.7 | 94 |
| Québec City–Windsor Corridor | Sum of 18 metropolitan areas | 19.5 | 52 |
| Guatemala | The whole country | 18.7 | — |
The next regions down are half the size. Chicago has 10.0 million people, Washington–Baltimore 10.3 million and the San Francisco Bay Area 9.1 million. At the other end, the Boston-to-Washington corridor exceeds 50 million: a different scale.
Mexico has only two regions of this size: the capital and the Bajío-Occidente. The industrial Northeast (Nuevo León, Coahuila and Tamaulipas) has 13.3 million.
The closest mirror: the Texas Triangle
Of the nine, the region most like the Bajío-Occidente is the Texas Triangle. Both are polycentric: neither depends on a single city. Guadalajara holds about a quarter of the Bajío-Occidente’s population; Dallas–Fort Worth, 40% of the Triangle’s. New York, Mexico City and Los Angeles, by contrast, are each one metropolis with its satellites.
Both are inland, both live on manufacturing and logistics, and both sit on the same axis: Mexico’s Highway 57 and Interstate 35 form the corridor that carries much of Mexico’s export economy.
The Bajío-Occidente is also more compact. In a straight line, the Guadalajara–San Luis Potosí–Querétaro triangle has a perimeter of 787 km; the Dallas–Houston–San Antonio triangle, 1,073 km.
Same people, one-sixth of the economy
The difference is in what each person produces.
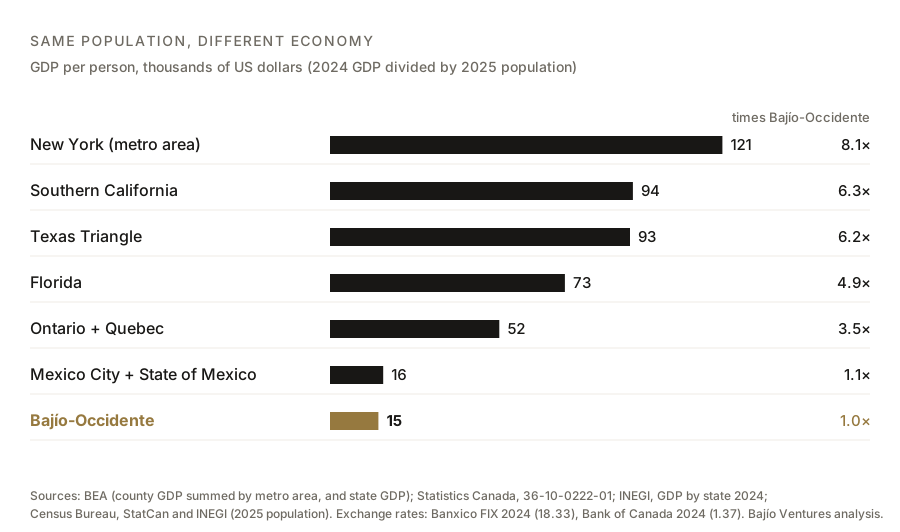
The Bajío-Occidente generated GDP of MXN 6.06 trillion in 2024, about USD 331 billion: 18.1% of Mexico’s economy. The Texas Triangle, with practically the same population, produced USD 2.03 trillion, six times more. Per person the ratio is the same: USD 15,000 against USD 93,000.
Three readings follow from the chart:
- The Bajío-Occidente is already level with the capital. It produces USD 15,000 per person, against USD 16,500 for Mexico City and the State of Mexico combined, and 7% above the national average (USD 14,000). The gap with the capital, which dominated the twentieth century, has practically closed.
- The distance to Canada is smaller than to the United States. Ontario and Quebec produce 3.5 times more per person; Texas and California, more than six times. The Canadian corridor is the intermediate reference: a manufacturing, exporting region that reached a different level of productivity.
- The exchange rate exaggerates the gap but does not create it. The figures are in current dollars. At purchasing power parity the distance shrinks, but it is still several-fold.
The same area, across the continent
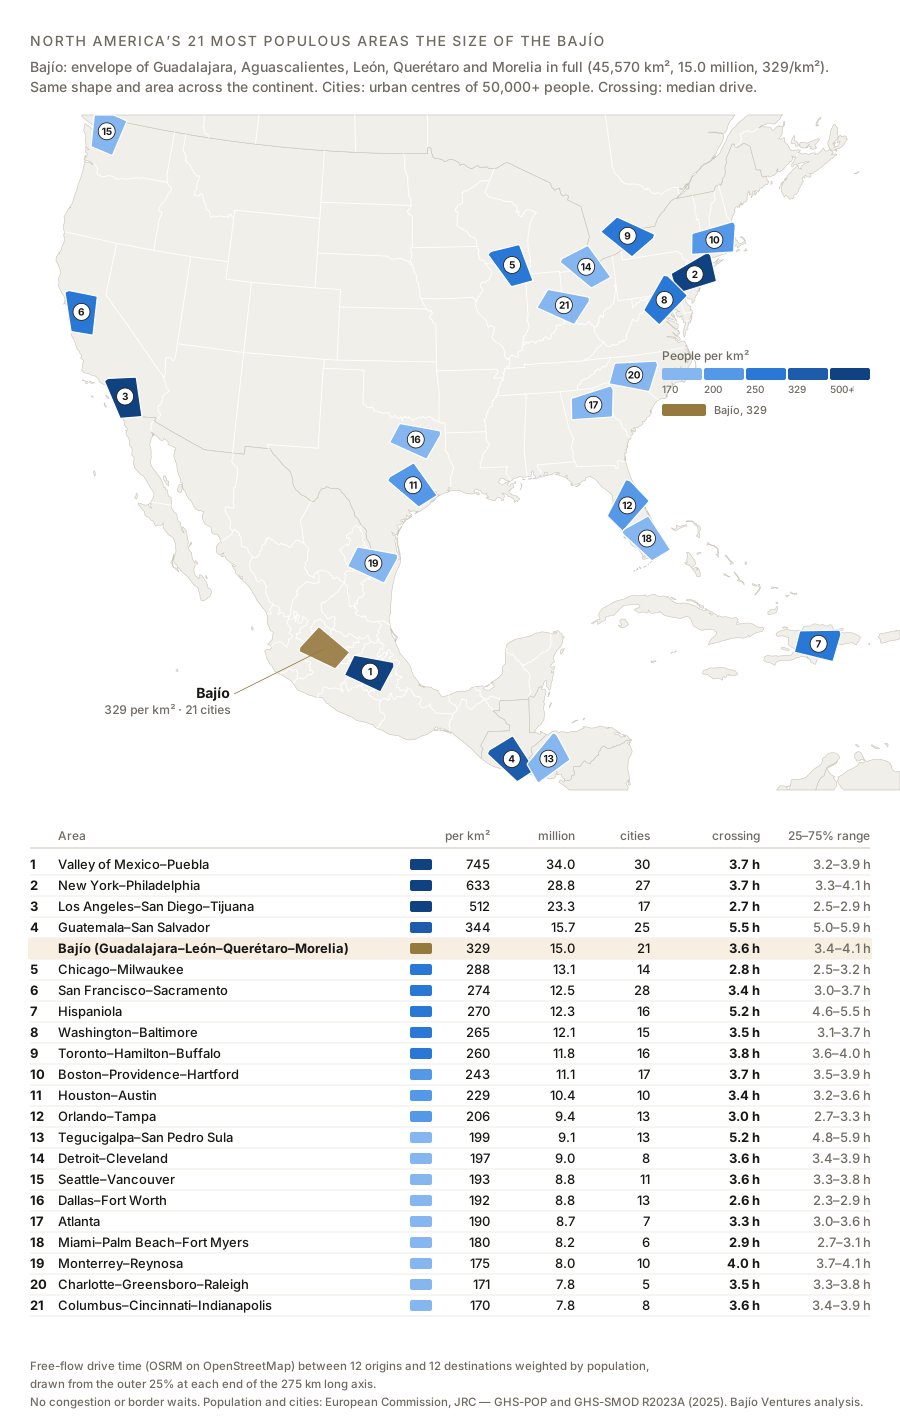
There is another way to measure the Bajío: by density. We took the cities at its edges — Guadalajara, Aguascalientes, León, Querétaro and Morelia — in full, with their whole built-up area under the international definition of an “urban centre” (at least 50,000 people and 1,500 per km²), and drew the smallest figure that contains them. Every city in between falls inside: Celaya, Irapuato, Salamanca, Silao and others. The figure covers 45,570 km², one and a half times the state of Guanajuato, and in 2025 it holds 15.0 million people: 329 per km², in 21 cities of 50,000 people or more.
We then took that figure, with the same shape and area, across the whole continent. At every point we rotated it in 15° steps, chose the most populous position, removed that population and repeated, until we had the 21 most populous areas of that size. For each one we counted the cities it contains and measured how long it takes to drive across it.
Four readings:
- Only four areas in North America are denser than the Bajío. Valley of Mexico–Puebla (745 people per km²), New York–Philadelphia (633), Los Angeles–San Diego–Tijuana (512) and Guatemala–San Salvador (344). Chicago (288), the San Francisco Bay Area (274) and Washington–Baltimore (265) fall below it.
- The Bajío is a network of cities, not a metropolis. It has 21 cities of 50,000 people or more; Los Angeles–San Diego–Tijuana has 17, Chicago–Milwaukee 14 and Houston–Austin 10. Only the Mexico City (30), San Francisco (28), New York (27) and Guatemala (25) areas have more.
- Crossing it takes as long as crossing the northern areas. From one populated end to the other, the median drive is 3.6 hours, within the U.S. and Canadian range: from 2.6 hours (Dallas–Fort Worth) to 3.8 (Toronto–Hamilton–Buffalo). Only Central America and Hispaniola are clearly slower (5.2 to 5.5 hours). These are congestion-free times: in New York, Los Angeles or Mexico City the real figure is higher.
- In Mexico, Monterrey is well behind. Its area (Monterrey–Reynosa) has 175 people per km², 10 cities and a 4.0-hour crossing: richer than the Bajío, but far less dense.
What this means for energy
Electricity use grows with output. A region of 22 million people that moves toward the productivity of the Texas Triangle will need much more grid, not a marginal adjustment.
We have written about both halves of that equation. Per person, Mexico invests a fraction of what the United States and China invest in their power systems. And today’s limit is the grid, not generation.
The map adds the scale. Very few places in North America hold 20 million consumers, workers and electricity users in one continuous space. The Bajío-Occidente is one of them, and it has the furthest to go.
How the figures were built
- Official units, not textbook megaregions. Each region is built from official statistical units: whole states in Mexico and for Florida; Census Bureau metropolitan areas in the United States (the Texas Triangle adds the Dallas–Fort Worth and Houston combined areas and the Austin and San Antonio metropolitan areas; Southern California, the Los Angeles combined area and the San Diego metropolitan area). Statistics Canada does not publish a total for the Québec City–Windsor Corridor; the 19.5 million is the sum of its 18 metropolitan areas and leaves out the towns and rural areas in between.
- “Bajío-Occidente” here means five whole states, including areas such as the Huasteca, the Sierra Gorda and the Jalisco coast that are not Bajío in the strict sense. Mexico City and the State of Mexico are also counted in full; the Valley of Mexico metropolitan area had 21.8 million people in the 2020 Census, and the 2025 Intercensal Survey has not yet published figures by metropolitan area.
- Population 2025. INEGI counts people in private dwellings (130.4 million nationally; 130.9 million including collective dwellings). United States: estimates for July 1, 2025. Canada: metropolitan areas at July 1, 2025. Guatemala and Hispaniola: World Bank, 2025.
- GDP per person = 2024 GDP divided by 2025 population, the latest year common to all three countries. In growing regions this slightly understates the value. For the United States we use BEA county GDP summed by metropolitan area (metropolitan areas are somewhat smaller than combined areas: 20.1 million in New York, 20.9 million in Southern California and 21.8 million in the Texas Triangle) and BEA state GDP for Florida. For Canada we use Ontario and Quebec in full (25.3 million). INEGI’s 2024 GDP is preliminary. Exchange rates: Banxico’s 2024 average FIX (18.33 pesos per dollar) and the Bank of Canada’s annual average (1.37 Canadian dollars per dollar).
- Density and cities. Population: European Commission GHS-POP R2023A grid (2025 estimate, ~1 km cells), which spreads census counts over built-up land; its totals do not match INEGI’s exactly (in the Bajío, between −10% and +5% by state). Cities: urban centres from the GHS-SMOD R2023A grid (the European Commission and UN Degree of Urbanisation), counted when their centre falls inside the area. The Bajío figure is the convex envelope of the full urban centres of Guadalajara, Aguascalientes, León, Querétaro and Morelia; its area is geodesic. The Bajío is fixed first and its population reserved, so no other area can take Querétaro or Morelia. The search ran on an equal-area projection with 2 km cells; each chosen area removes its population before the next search, so no one is counted twice. Venezuela and Colombia are excluded as South America.
- Crossing time. For each area we take its long axis (275 km) and pick 12 origins in the outer 25% at one end and 12 destinations in the outer 25% at the other, at random and weighted by population. The figure is the median of the 144 car trips computed with OSRM on OpenStreetMap at free flow: no congestion and no border waits.
Sources: INEGI — 2025 Intercensal Survey, national release · INEGI — GDP by state 2024 · U.S. Census Bureau — combined statistical area population estimates, Vintage 2025 · U.S. Census Bureau — metropolitan areas, Vintage 2025 · U.S. Census Bureau — states, Vintage 2025 · BEA — GDP by county 2024 · BEA — GDP by state · Statistics Canada — population by metropolitan area, table 17-10-0148-01 · Statistics Canada — population by province, table 17-10-0005-01 · Statistics Canada — GDP by province, table 36-10-0222-01 · World Bank — total population · Banxico — FIX exchange rate · Bank of Canada — annual average exchange rates · Expansión — Centro-Bajío-Occidente Alliance, Feb 2020 · European Commission, JRC — GHS-POP R2023A, 2025 estimate (30 arc-seconds) · Project OSRM — routing on OpenStreetMap
Bajío Ventures — a Mexican energy-infrastructure investment group based in Guanajuato: capital, a data platform on the region’s industrial base, and a German industrial channel, with its own advisory presence in Berlin.
Origination and structuring of USD 5–50M infrastructure projects across the Bajío.
Let's discuss your projectThis article is also available in Spanish. Read in Spanish