Sustainable development
Agenda 2030 in the Bajío–Centro-Occidente: four years to go
Eleven of fifteen years on, poverty fell in all six states, but formal employment did not move, lack of health access rose everywhere and 91 of 146 aquifers have no water available. Distributed generation doubled. One table with a source and year for every figure.
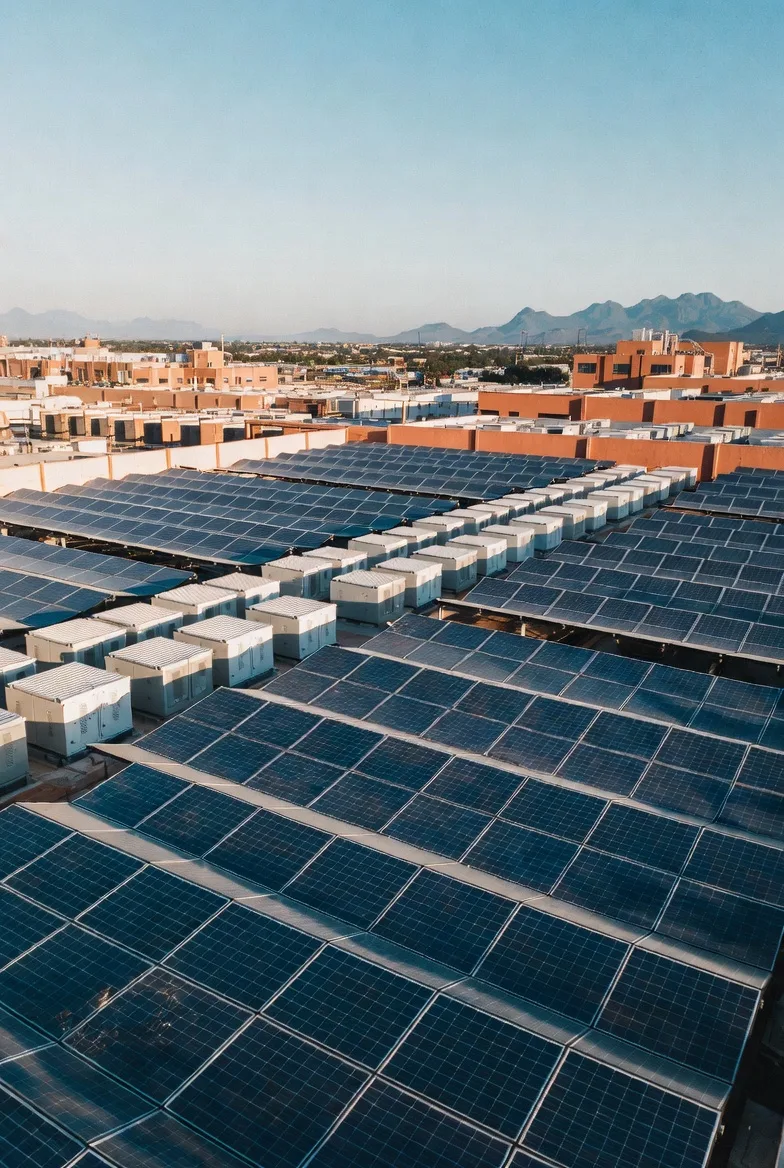
Water, energy and sustainable development with state governments, municipalities and industry in the Bajío.
Let's talk about your projectBajío Ventures · October 2026 · Companion to the From commitment to project series
This post extends the comparison of the Bajío states with the indicators and their trend, and adds Zacatecas.
In February 2022, Líder Empresarial asked how the Bajío–Centro-Occidente region was doing on the 2030 Agenda, six years after its adoption. The answer, drawn from an LNPP-CIDE document, said which indicator was highest and which lowest in each state, but gave no figures or years.
Eleven of the fifteen years have now passed, about 73% of the window. We repeated the exercise for the same six states: Aguascalientes, Guanajuato, Jalisco, Querétaro, San Luis Potosí and Zacatecas. This time every figure has a source, a year and a point of comparison. The question has changed: it is no longer how we are doing, but what can still be reached by 2030.
The region in one table
| Indicator | Ags | Gto | Jal | Qro | SLP | Zac | National |
|---|---|---|---|---|---|---|---|
| Poverty, % (2018 → 2024) | 26.3 → 17.1 | 41.5 → 26.0 | 27.8 → 18.6 | 26.4 → 16.3 | 42.1 → 30.4 | 49.2 → 36.4 | 41.9 → 29.6 |
| Extreme poverty, % (2018 → 2024) | 1.0 → 0.6 | 3.6 → 1.7 | 2.3 → 1.3 | 1.7 → 1.1 | 6.7 → 5.1 | 3.6 → 3.5 | 7.0 → 5.3 |
| Lack of access to health services, % (2018 → 2024)¹ | 11.4 → 25.2 | 13.7 → 33.7 | 19.4 → 32.0 | 11.8 → 24.1 | 9.0 → 33.4 | 11.7 → 33.8 | 16.2 → 34.2 |
| Lack of social security, % (2018 → 2024) | 35.8 → 32.8 | 54.2 → 46.0 | 45.5 → 40.3 | 45.9 → 37.4 | 52.6 → 51.2 | 61.6 → 52.9 | 53.5 → 48.2 |
| Educational lag, % (2018 → 2024) | 15.6 → 15.0 | 22.2 → 21.1 | 19.3 → 19.1 | 17.5 → 14.5 | 19.7 → 18.8 | 20.8 → 18.8 | 19.0 → 18.6 |
| Labour informality, % of employed (Q2 22 → Q2 26) | 40.4 → 42.5 | 56.1 → 54.8 | 47.3 → 46.5 | 42.7 → 39.2 | 54.1 → 54.9 | 61.6 → 61.2 | 55.7 → 55.1 |
| Municipal wastewater treated, % of collected flow (2021 → 2023) | 98.3 → 97.8 | 60.6 → 72.3 | 77.3 → 98.3 | 50.3 → 63.7 | 68.0 → 59.9 | 58.5 → 62.8 | 67.5 → 67.0 |
| Aquifers with no availability (DOF 2023) | 5 of 5 | 13 of 18 | 35 of 59 | 7 of 11 | 11 of 19 | 20 of 34 | — |
| Distributed generation, MW (2022 → 2025)² | 84 → 145 | 157 → 358 | 407 → 748 | 52 → 127 | 52 → 119 | 24 → 50 | 2,630 → 5,190 |
| Debt / unrestricted revenue, % (2021 → Q3 25) | 34.7 → 19.9 | 34.8 → 20.2 | 47.5 → 28.4 | 0.0 → 5.5 | 33.5 → 19.5 | 60.3 → 40.9 | — |
| IMCO competitiveness rank of 32 (ICE 2022 → 2026) | 6 → 8 | 18 → 16 | 5 → 6 | 4 → 2 | 17 → 10 | 28 → 28 | — |
¹ The ENIGH health-affiliation question changed after Seguro Popular was abolished. Part of the jump is measurement, not only real access. ² 2022 figures (CRE) include legacy SIPyME contracts; 2025 figures (CNE) do not. Real growth is equal to or larger than shown.
What improved: poverty and public finances
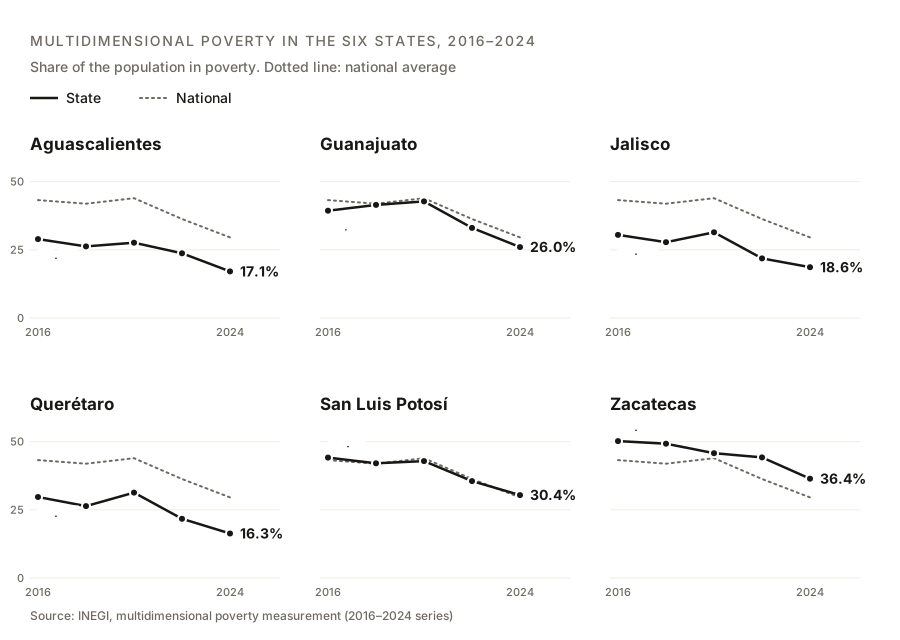
Poverty fell in all six states. Guanajuato had the largest drop: 15.5 points, from 41.5% to 26.0%, more than the national average (12.3 points). Aguascalientes, Querétaro and Jalisco are now between 16% and 19%.
But the region runs at two speeds. San Luis Potosí (30.4%) and Zacatecas (36.4%) remain above the national average, and extreme poverty in Zacatecas barely moved: from 3.6% to 3.5%.
The full series also shows a rise in 2020, the pandemic year, in five of the six states. Zacatecas is the exception.
State finances also have more room. Debt as a share of unrestricted revenue fell by 14 to 19 points in five of the six states. Querétaro is the exception only on paper: it went from 0.0% to 5.5% and remains by far the least indebted. All six are rated “sustainable” in SHCP’s early-warning system.
What did not move: formal jobs and social protection
Poverty fell, but jobs did not formalise. Over four years, labour informality barely changed across the region. Querétaro fell 3.5 points; Aguascalientes rose 2.1 and San Luis Potosí 0.8. Zacatecas remains above 61%.
The starkest figure is access to health services. The deprivation rose in all six states and at least doubled in five; in San Luis Potosí it nearly quadrupled, from 9.0% to 33.4%. Part of this is a measurement effect after Seguro Popular ended, but no state is close to its 2018 level. If SDGs 3 and 8 have 2030 targets, this is the widest gap.
More people, unevenly spread
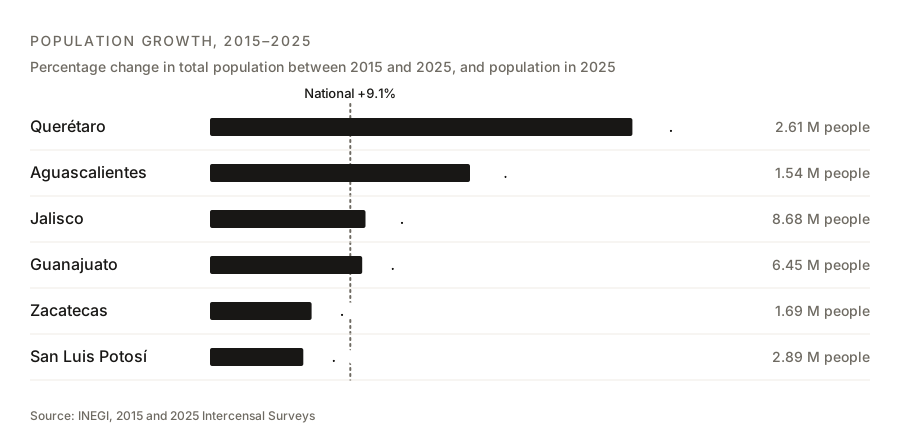
Between 2015 and 2025 the population of the six states grew from 21.41 to 23.85 million. Growth concentrated where poverty is lowest: Querétaro grew 27.5% and Aguascalientes 17.0%, against 9.1% for the country. San Luis Potosí (6.1%) and Zacatecas (6.6%) grew less than the national average.
The two fastest-growing states are also the ones with the least water available: in Aguascalientes none of its five aquifers has water available, and in Querétaro seven of eleven have none.
The constraint that defines the region: water
Nearshoring conversations in the Bajío usually start with electricity. The data says the limit is water.
Of the 146 aquifers in the six states, 91 (62%) have no available water, according to CONAGUA’s agreement published in the DOF in November 2023. In Aguascalientes it is all five. Among the largest deficits are those in the industrial corridor: Valle de Celaya, Pénjamo-Abasolo, Valle de Aguascalientes and Valle de Querétaro.
Wastewater treatment advanced where there was investment: Jalisco rose from 77.3% to 98.3% between 2021 and 2023, Guanajuato from 60.6% to 72.3% and Querétaro from 50.3% to 63.7%. San Luis Potosí fell back from 68.0% to 59.9%. Treating more water and reusing it in industry is the most direct lever states have for SDG 6.
Energy: the transition is already happening on rooftops
Distributed generation capacity (systems under 0.7 MW connected to the distribution grid) doubled in the region: from 775 MW at end-2022 to 1,548 MW at end-2025. The region holds close to 30% of national capacity. Querétaro (+146%), San Luis Potosí (+130%) and Guanajuato (+128%) grew faster than the country (+97%).
This is the part of SDG 7 that moves without waiting for large projects: businesses and households fund it, roof by roof. The challenge now is the grid. More distributed generation in industrial parks needs fast interconnection, storage and clear CNE rules.
What comes next for 2030
With four years left, these are the priorities the data points to for the region:
- Formal employment. Poverty fell without formalisation. Without formal jobs there is no social security or health access, and those two are now the highest deprivations in this comparison.
- Water as industrial infrastructure. Treatment, reuse and metering in the corridor’s aquifers. It is the condition for industrial investment to keep arriving.
- A grid for distributed generation. Capital is already going onto rooftops; the grid to integrate it is missing.
- Closing the internal gap. Zacatecas and San Luis Potosí decide whether the region reaches 2030 as a bloc or at two speeds.
At Bajío Invest we cross water, energy and infrastructure data at industrial-park and municipal level. We will update this comparison when the 2026 data is published.
Sources: Líder Empresarial — Agenda 2030, ¿cómo va la región Bajío-Centro-Occidente?, Feb 2022 · INEGI — multidimensional poverty 2024, 13 Aug 2025 · INEGI — poverty indicators by state (BISE) · INEGI — ENOE, Q2 2026 · INEGI — ENOE, Q2 2022 · CONAGUA — Situación del Subsector Agua Potable, Alcantarillado y Saneamiento, edition 2024 · CONAGUA — Situación del Subsector, edition 2022 · DOF — aquifer water availability, 9 Nov 2023 · CRE — distributed generation statistics, H2 2022 · CNE — distributed generation statistics, H2 2025 · CEFP — early-warning system, Cuenta Pública 2021 · CEFP — early-warning system, Q3 2025 · IMCO — State Competitiveness Index 2022 · IMCO — State Competitiveness Index 2026 · INEGI — 2025 Intercensal Survey, results · INEGI — Indicator Bank, total population by state
Water, energy and sustainable development with state governments, municipalities and industry in the Bajío.
Let's talk about your projectThis article is also available in Spanish. Read in Spanish