Thesis
San Luis Potosí in Texas: Houston or Dallas, depending on the municipality
Two out of three migrants from San Luis Potosí live in Texas. Inside Texas they split almost evenly between the Houston and Dallas consular districts, and the municipality of origin decides which: the capital and its neighbours go to Dallas, the Zona Media to Houston.
Origination and structuring of USD 5–50M infrastructure projects across the Bajío.
Let's discuss your projectBajío Ventures · March 2026
San Luis Potosí is more tied to Texas than any Mexican state that does not border it: 67.4% of the consular ID cards issued to its people in 2022 went to Texas residents. Inside Texas the state splits almost evenly in two. In 2018 the Houston consular district issued 25.2% of all cards for San Luis Potosí and Dallas 24.4%, and which of the two a migrant ends up in depends on the municipality they left.
The finest public cut
A consular district is the block of counties one Mexican consulate serves: roughly Harris County and southeast Texas for Houston, and Dallas–Fort Worth and North Texas for Dallas. It is the closest public data gets to a county. No published table links a Mexican municipality to a single U.S. county.
The file used here covers the 31,768 consular ID cards (matrículas consulares) issued in 2018 to people born in San Luis Potosí. It records the municipality of origin of each holder and the consulate that issued the card, across all 58 municipalities and the 47 consular districts that issued at least one.
Ten districts, 82% of the cards
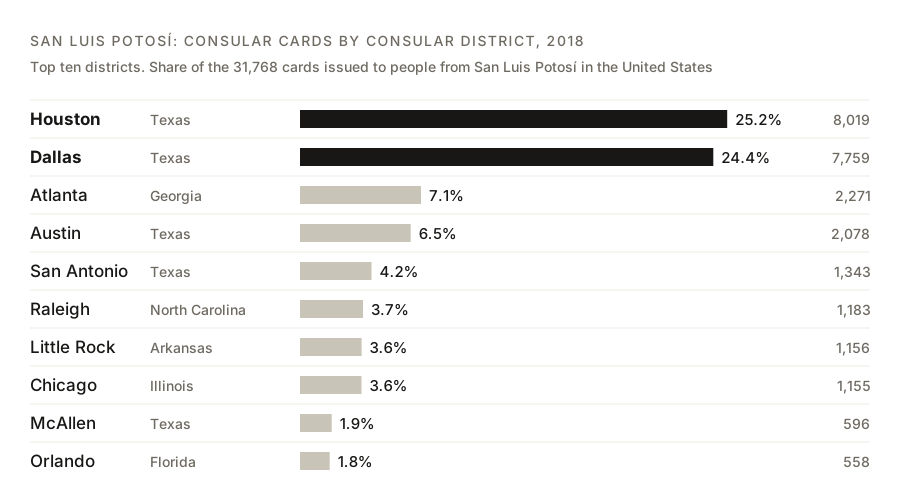
Houston and Dallas together account for half of the state’s cards. The rest of Texas adds another 15%, led by Austin (6.5%) and San Antonio (4.2%).
Outside Texas the pull is toward the Southeast, not California. Atlanta is the third district with 7.1%, followed by Raleigh (3.7%) and Little Rock (3.6%). Chicago matches Little Rock at 3.6%. Los Angeles issued 1.4%.
The municipality decides
Houston is the leading district in 29 of the 58 municipalities and Dallas in 24. Atlanta leads in three, and Albuquerque and Brownsville in one each.
| Municipality | Cards, 2018 | First | Second | Third |
|---|---|---|---|---|
| San Luis Potosí (capital) | 5,205 | Dallas 27.0% | Houston 21.4% | Chicago 9.6% |
| Rioverde | 3,434 | Houston 25.2% | Dallas 19.4% | Austin 11.6% |
| Matehuala | 1,975 | Houston 39.4% | Dallas 27.4% | Atlanta 5.3% |
| Ciudad Valles | 1,299 | Houston 25.7% | Dallas 17.7% | Atlanta 9.9% |
| Ciudad Fernández | 1,132 | Houston 30.4% | Dallas 19.9% | Raleigh 9.4% |
| Mexquitic de Carmona | 1,116 | Dallas 46.1% | Houston 17.5% | San Antonio 5.6% |
| Ciudad del Maíz | 1,007 | Houston 29.5% | Dallas 27.9% | Atlanta 7.0% |
| Santa María del Río | 997 | Dallas 29.5% | Houston 19.4% | Little Rock 10.1% |
| Cerritos | 958 | Houston 42.9% | Dallas 19.8% | Atlanta 4.0% |
| Villa de Ramos | 842 | Atlanta 16.0% | Dallas 15.3% | Houston 11.6% |
| Ahualulco | 711 | Dallas 65.1% | Houston 11.5% | Austin 4.1% |
| Guadalcázar | 684 | Houston 32.5% | Dallas 19.4% | San Antonio 9.2% |
| Rayón | 651 | Houston 39.2% | Dallas 16.9% | Atlanta 11.7% |
| Tamasopo | 647 | Houston 24.7% | Dallas 15.6% | Austin 12.8% |
| Salinas | 603 | Atlanta 24.0% | Dallas 15.1% | Indianapolis 10.0% |
The Dallas side
The capital and the municipalities around it lean to Dallas, some heavily. Ahualulco sends 65.1% of its migrants there, Villa Hidalgo 52.7% and Mexquitic de Carmona 46.1%. Further north, Moctezuma (44.3%) and Cedral (41.4%) make the same choice.
The capital itself is less concentrated: 27.0% Dallas, 21.4% Houston and 9.6% Chicago. It supplies 499 of the state’s 1,155 Chicago cards, 43% of the total.
The Houston side
The Zona Media leans to Houston: Rioverde (25.2%), Ciudad Fernández (30.4%), Cárdenas (34.3%), Rayón (39.2%) and Cerritos (42.9%). So do Matehuala (39.4%) and Villa de Guadalupe (53.7%) in the Altiplano.
In the Huasteca, Houston still leads in Ciudad Valles and Xilitla, but the flow spreads more widely. Ciudad Valles sends 25.7% to Houston and 9.9% to Atlanta. Xilitla sends 22.4% to Houston, 13.4% to Little Rock and 8.6% to Laredo.
The exceptions
A few municipalities do not put Texas first. Salinas sends 24.0% of its migrants to the Atlanta district and 10.0% to Indianapolis. Villa de Ramos and Tamazunchale also have Atlanta as their first district, with 16.0% and 15.3%.
Santo Domingo is the clearest outlier: 20.4% of its cards were issued in Albuquerque. Those 80 cards are more than two-thirds of the 116 that the Albuquerque consulate issued to the whole state.
How to read these numbers
- They count cards, not residents. People with other U.S. identification have less reason to apply, so long-settled and naturalised migrants are probably under-represented.
- A district is not a county. The data says which consulate issued the card. It cannot separate Dallas from Fort Worth, or Houston from the rest of southeast Texas.
- They are from 2018. The state-level pattern has held since: Texas residents received 64.5% of the cards in this file and 67.4% in 2022.
- Only San Luis Potosí is covered. The same file was published for other Mexican states. For this note only San Luis Potosí’s copy, preserved in the Internet Archive, could be retrieved.
The practical reading is that San Luis Potosí’s diaspora has two addresses, not one. Anything aimed at it — remittance corridors, hometown clubs, state outreach — starts in Dallas for the capital and its neighbours, and in Houston for the Zona Media.
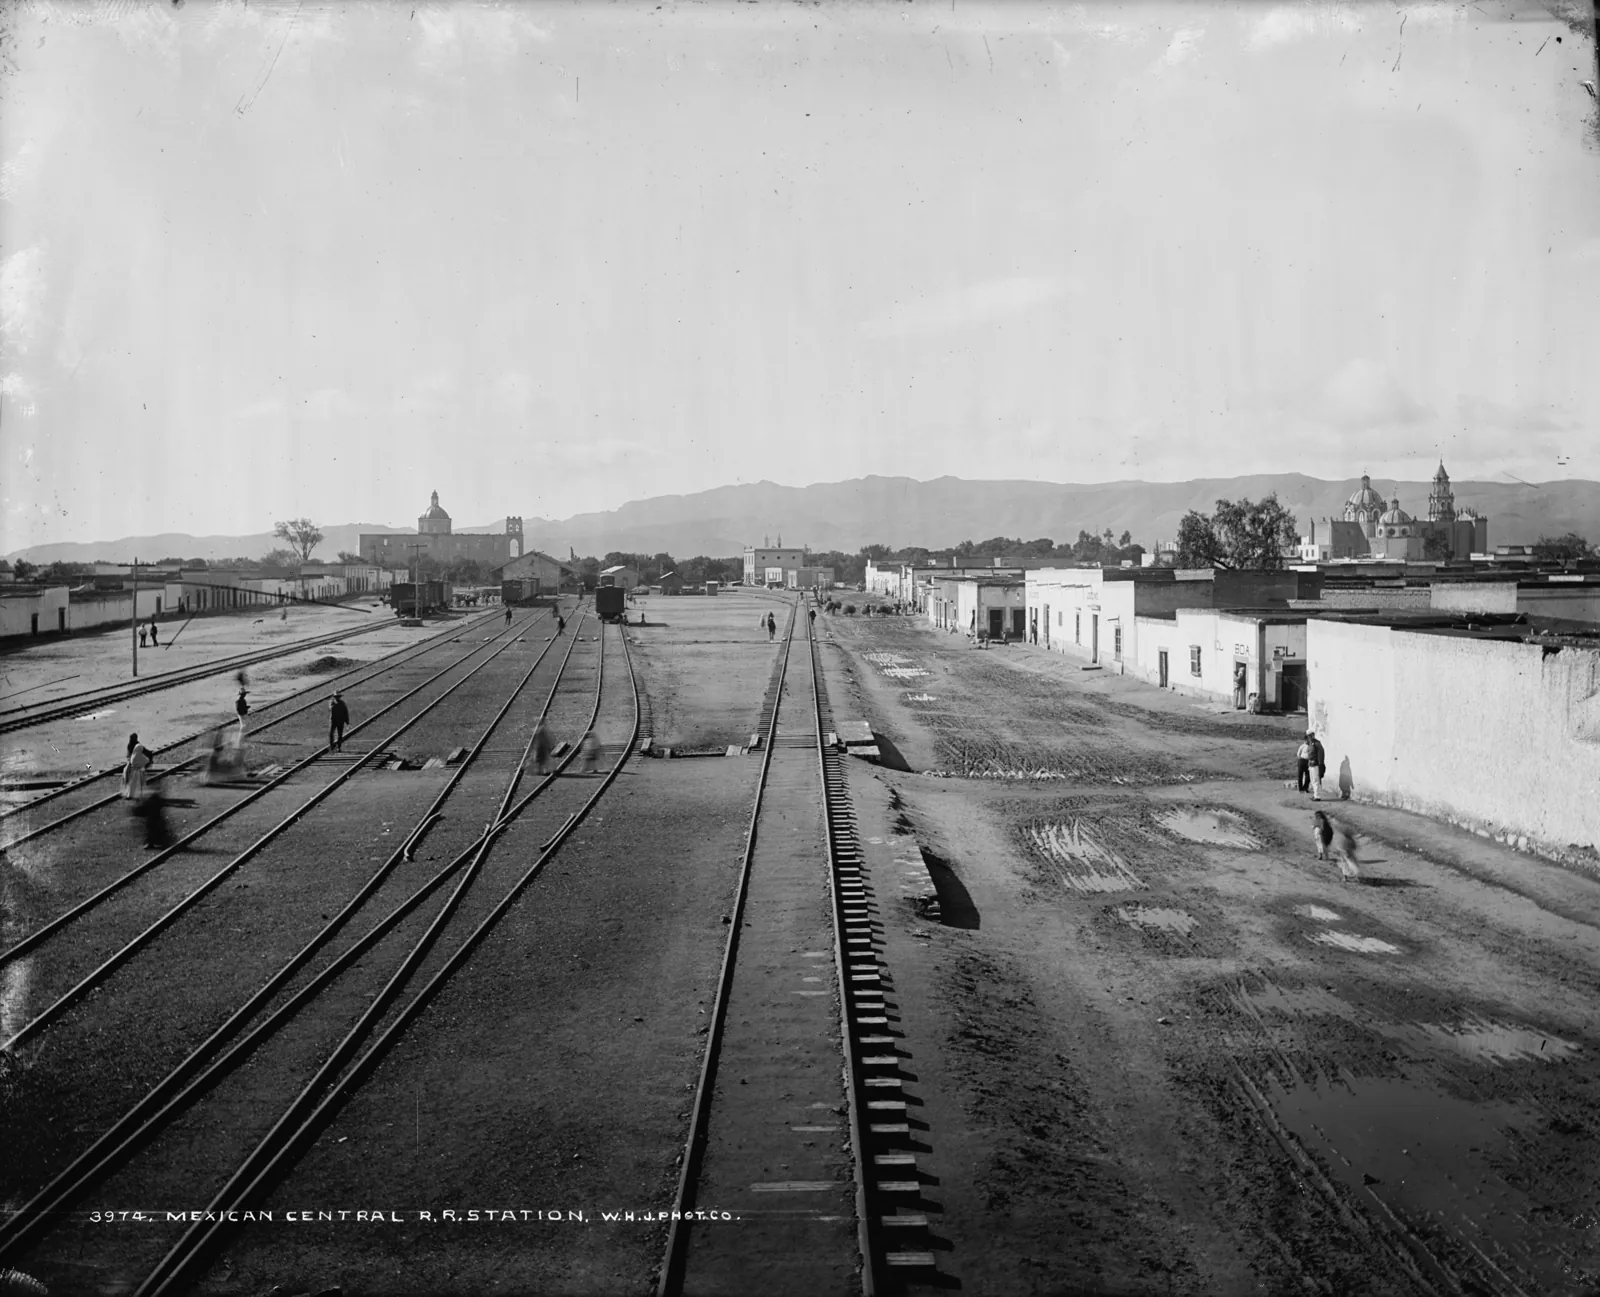
Image: photograph by William Henry Jackson, U.S. Library of Congress (no known restrictions on publication).
Sources: Instituto de los Mexicanos en el Exterior — Matrículas consulares expedidas a originarios de San Luis Potosí en el 2018 (Internet Archive copy, 4 March 2026) · BBVA Research, Fundación BBVA and CONAPO — Anuario de Migración y Remesas México 2025, chart 4.14 (consular registrations by state of origin, 2022)
Bajío Ventures — a Mexican energy-infrastructure investment group based in Guanajuato: capital, a data platform on the region’s industrial base, and a German industrial channel, with its own advisory presence in Berlin.
Origination and structuring of USD 5–50M infrastructure projects across the Bajío.
Let's discuss your projectThis article is also available in Spanish. Read in Spanish